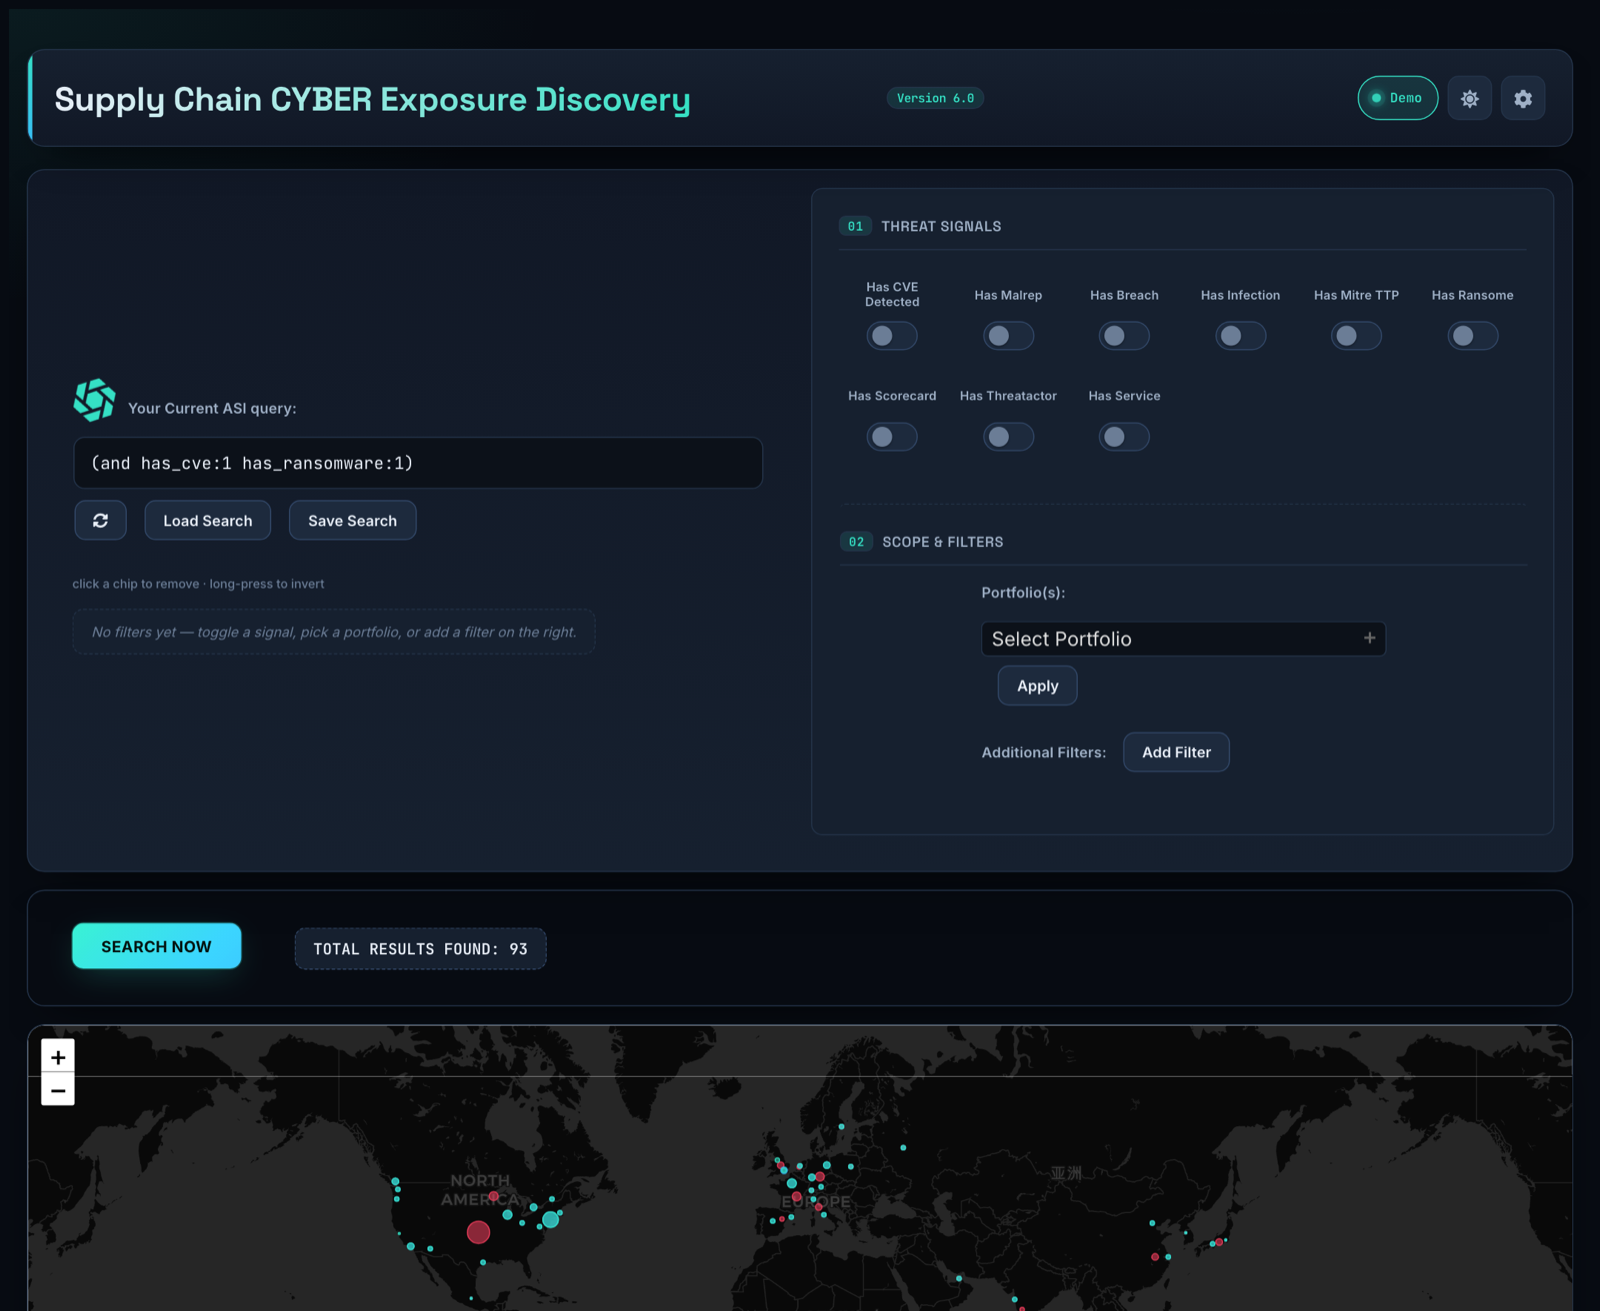
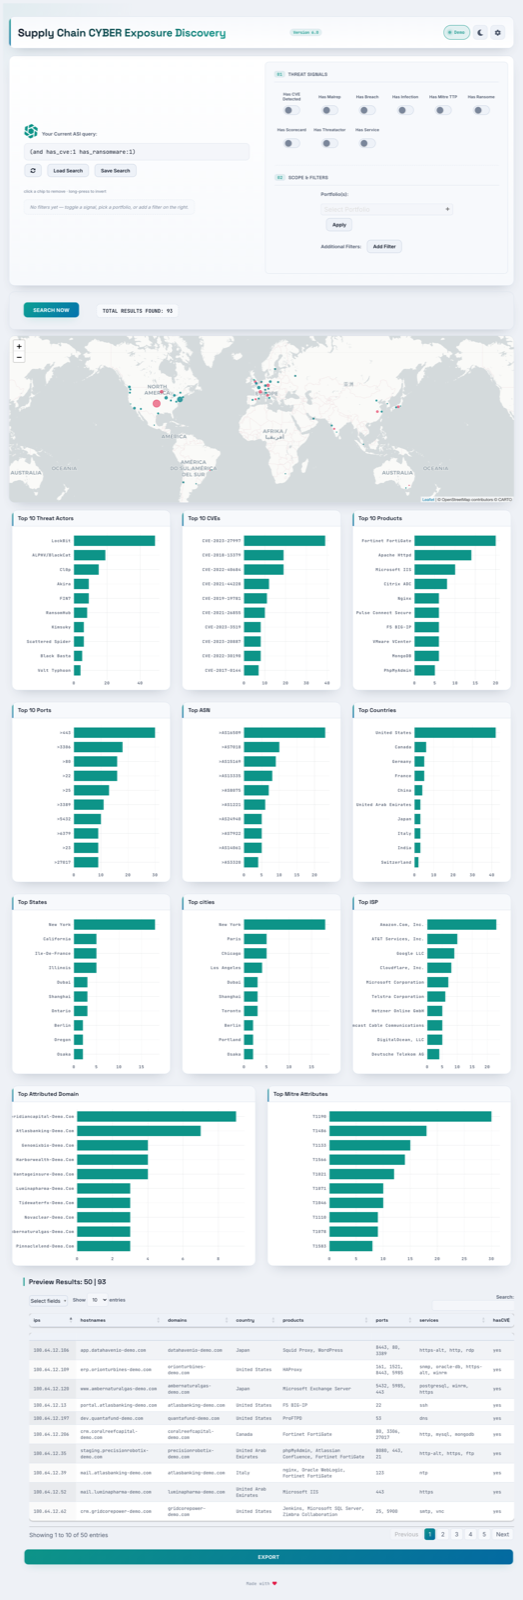
A zero-install security console that turns attack-surface queries into live tables, ranked charts, and a geographic threat map — all from a single HTML file, with a fully offline demo mode.
0 installs1 HTML file1,500 demo findings11 live chartsno backend
ASI-Query-V6.0.html
// Capabilities
Everything a supply-chain analyst needs, in one surface.
Compose queries, drill into charts, map exposure geographically, and export — without leaving the page or standing up a backend.
ASI query builder
Boolean logic (and / or / not), ranges, and negation — plus nine one-click threat-signal toggles for CVE, ransomware, breach, infection, MITRE TTP and more.
Eleven ranked charts
Top threat actors, CVEs, products, ports, ASN, ISP, countries, states, cities, attributed domains, and MITRE techniques. Click any bar to drill straight into the query.
Geographic threat map
Interactive Leaflet map with zoom-scaled, severity-colored device markers and theme-matched basemaps.
Third-party portfolios + fourth-party discovery
Review ASI vendor portfolios, then expand from portfolio vendors into fourth-party exposure discovery in one workflow.
Export everything
CSV (preview or all findings), JSON, and re-indexed exports by domain, CVE, product, service, port, CPE, library, or org.
Active-filter chips
Every applied filter becomes a removable chip — click to remove, long-press to invert — so the query never becomes an opaque wall of text.
Dual, intentional themes
A dark security-ops console and a light analyst report — both designed on purpose, toggled and remembered across sessions.
// No API key required
A full demo mode, entirely offline.
The dashboard ships with a self-contained demo engine so every screen, chart, filter, and export works before you ever add a key.
Auto-activates with no key, or on an auth failure (HTTP 401/403).
1,500 deterministic findings from a seeded generator — identical every load.
Search, facets, five portfolios, and fourth-party vendor discovery all resolve locally.
Map renders offline — demo locations carry their own coordinates.
All data is fictional: -demo.com domains and reserved IP ranges. Nothing references a real host.
// Query language
Expressive queries, one click to launch.
Field matches, boolean groups, ranges, and negation — build them by hand or with the toggles and dropdowns.
os_type:'FortiOS'# simple match cve:'CVE-2023-27997'# by CVE
(and has_ransomware:1 has_cve:1) # AND
(or port:'3306' port:'5432') # OR
(not os_type:'FortiOS') # negation
attributed_domain_count:[1,5] # range
# One gateway, two modes apiFetch(url, opts) demo → DemoEngine.resolve() live → fetch() # 401/403 → demo
# The live-API path is fully preserved. # Add a key in ⚙ Settings, toggle # Demo off, and you're live.
// Under the hood
One file. No build. No backend.
Vanilla JavaScript orchestrating a small set of battle-tested libraries, all via CDN. Open it from file:// and it runs.